Navigating Your Dashboard
Dashboard
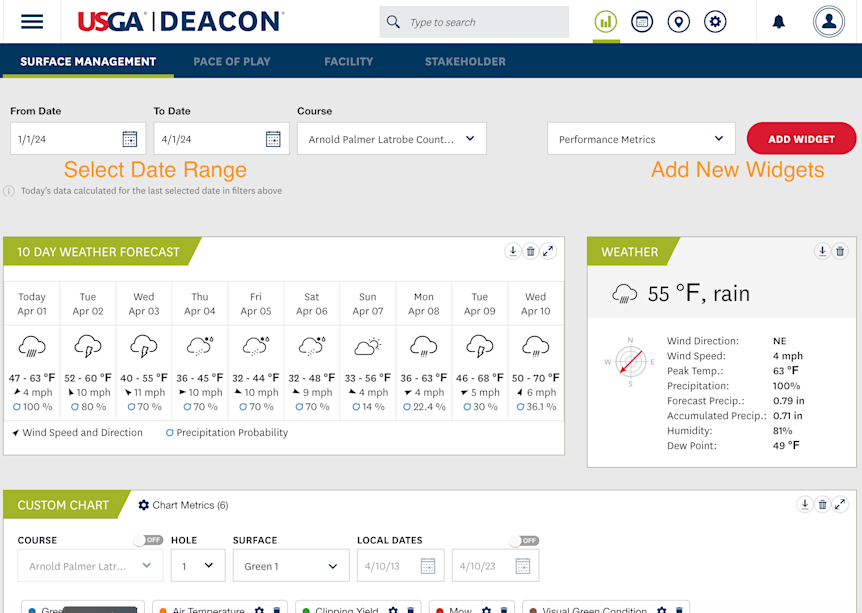
Once logged in, you are automatically directed to your dashboard view. You can set some common settings such as From & To Date filters and Course selection. These settings are saved even if you sign out of the application. Among available actions, you can add, delete widgets. To add a chart, select a required widget in the drop-down menu and click the red "Add widget" button.

Widgets
- Custom Charts: Evaluate any metrics in the Deacon platform by using the Custom Chart. This gives you the ability to select a metric for each vertical axis and set a line, dot or bar chart.
- Performance Metrics: All your GS3 data (speed, firmness, smoothness and trueness) in one place.
- Product Applications: Summary data of all pesticide, fertilizer and other material applications.
- Daily Charts: Track key data, including clipping yield and green speed, and compare to historical averages and targets.
- Clipping Yield: View trends in putting green growth.
- Soil: Includes temperature, moisture, light and salinity data.
- Summary Table: All key surface measurement data and maintenance practices all in one place.
- Product: View information on products applied by individual applications, totals, date ranges and playing surface or hole numbers.
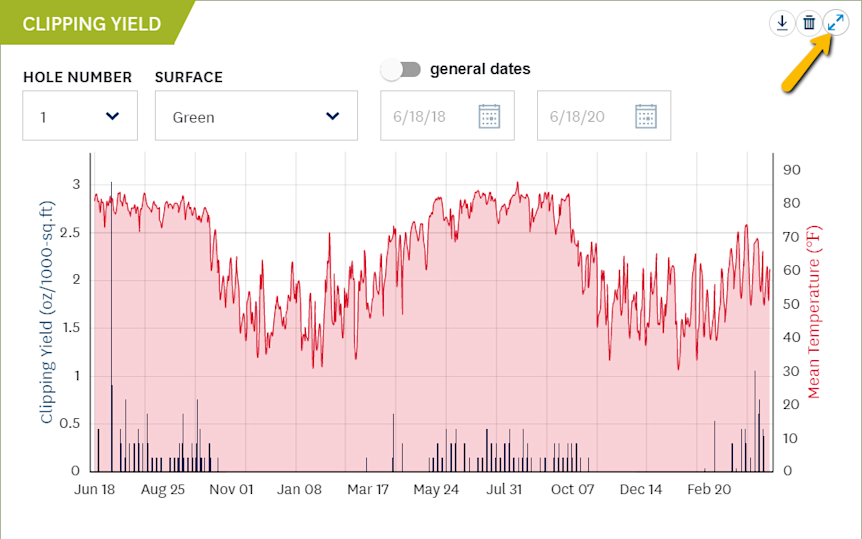
If you want to delete a chart, use the trash bin icon in the right corner. For convenience, all charts can be opened in the fullscreen mode using the corresponding button:

Tip: You can download figures to your computer for use in presentations and other documents.
Custom Chart
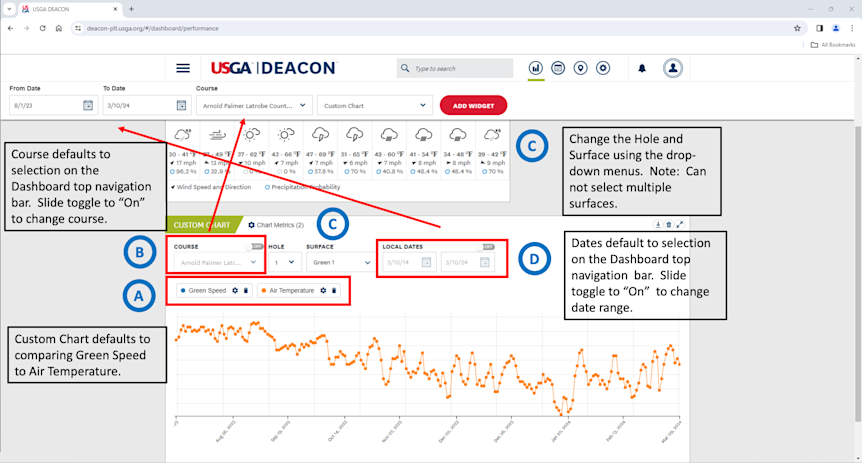
You can evaluate any metric in the Deacon platform by using the Custom Chart. This gives you the ability to select a metric for each vertical axis and set a line, dot or bar chart. When plotting applications you can only select a specific product to display at anyone time.

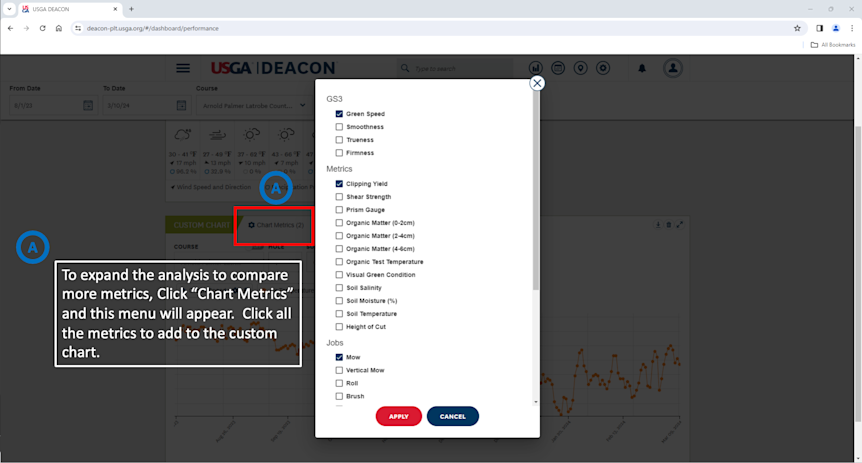
When setting up the custom chart you can click on Chart Metrics from which you will see all the available data points in DEACON. For specific sensors and products you can select the aggregate (i.e specific soil moisture sensor) or the average all all of them.

